The screen is divided into two parts, the trend display and the digital display.
You can add as many graphs as you like to the trend display, and plot an unlimited number of variables on each, at any scale you desire. The trend display also displays events, drugs, fluids, infusions, blood loss, urine output, positioning and heart rhythmn.
Screen Setup
Trend Display
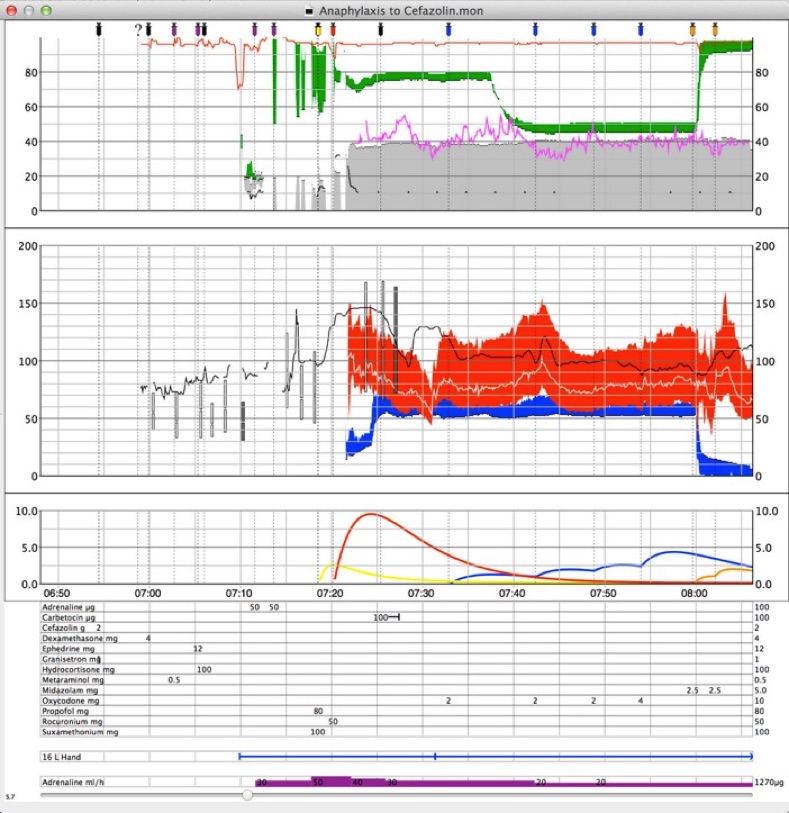
This is one possible layout for the trend display.
Icons for events are always shown above the top graph. The coloured syringes represent drug administration.
Below this is a respiratory graph showing SpO2 in red, BIS in pink and respiratory rate in black. Gases are shown as bars with a black dot on the expiratory side. Oxygen is shown here in green and CO2 in grey.
The next graph is a haemodynamic graph. The black line is heart rate. NIBP is shown here as unfilled rectangles from systolic to diastolic, with a break for mean. Arterial blood pressure is shown as a continuous red bar. If invasive blood pressure is not monitored, NIBP is displayed as solid red rectangles. The blue bars represent desflurane, shown at 10x scale.
The third graph shows calculated effect site concentrations for Propofol, Rocuronium, Oxycodone and Midazolam.
Below this is a standard table of drug bolus doses. The Carbetocin is shown as a dose with a line following to show that it was administered over two minutes.
Second from the bottom is a display of intravenous fluids and lines. The blue bars represent litre bags of Hartman’s Solution.
At the very bottom is an area to represent intravenous infusions of drugs, shown as a bar chart in ml/hr. On the right of this graph, and on the drug chart is the cumulative drug dose to that time.
On the left side of the screen is a split bar. If you pull this to the right, you can show graphs of two different times. You can always scroll the left graph using the slider at the bottom of the screen. You can ONLY scroll the right graph when you are NOT recording. When you are recording, the rightmost side of the right graph always shows the latest data. You can temporarily move the graph right (to look at past data) or left to look at predicted future pharmacokinetic data by swiping to the right or left.
The number at the bottom left of the screen is the current screen resolution in seconds per pixel. You can change the resolution either with a pinch gesture on the trackpad, or by using the time slider in Preferences -> Charts.
The data is sampled intermittently from the monitor. If you set the resolution higher than the maximum data resolution, you may start to see gaps on the graphs. For example, the CS5 sends out data at a maximum of once every five seconds. If you set the screen resolution to two seconds, you will see gaps.
You can choose which data is displayed in Preferences -> Data. Click on the parameter you wish to display and choose Show Trends. If the parameter is not shown on the list, click the plus button and choose it from the Data Type popup.
You can choose which graph to display the data on with the Graph popup. To display data with a different scale or offset, you can enter values for scale or offset. You can change the number of graphs in Preferences -> Charts. To add a chart click the plus button, then enter the scale and graduations that you want. If you want the graph to be displayed on screen click Display Chart. If you wish it to print, choose Print Chart. The Size Ratio slider changes the size of the selected graph compared to the other graphs on screen.
Digital Display
The digital display it only shown while the program is recording.
Data is shown on the right side of the screen.
You can change the size of the figures by dragging the split bar to the right or left.
You can choose which data is displayed in Preferences -> Data. Click on the parameter you wish to display and choose Show Digital.
If the parameter is not shown on the list, click the plus button and choose it from the Data Type popup. Choose the number of significant figures to display using the Sig Figs slider.
Changing Chart Layout
You can change the layout of the charts in Chart Preferences.
You can change the data on the charts, and the way it is displayed in Data Preferences.
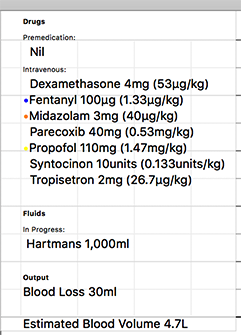
Summary Overlay
Data -> Show Summary will show a summary of drugs and fluids given in the top left hand corner of the screen.