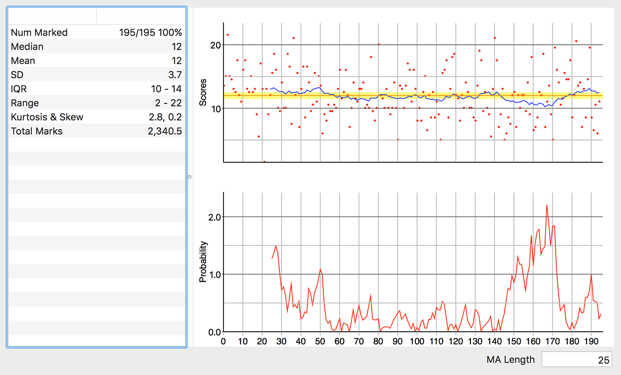
The statistics window provides some basic statistics on how the question is being answered. The kurtosis is unadjusted, so a normal distribution should have a value of 3. The total marks value allows you to see the global effect of making a change in the grid, or remarking a series of papers.
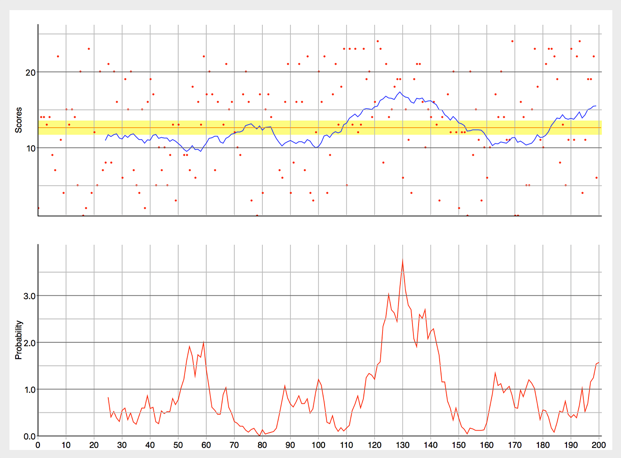
The scores graph plots the marks achieved by the candidates in the order that they were created. You can add a moving average to this of any given length. The orange line shows the mean mark, and the yellow bands show where 1.96 x the SEM lies from the mean. The moving average should at some stages lie outside this band.
Neither of these graphs are intended to show any particular statistical significance. Even randomly generated numbers, such as those in the graph below may show apparent trends. These graphs should be used rather to indicate groups of papers which may benefit from being re-checked. Double clicking on the chart will open the Candidate Editor window with the candidate whose score is plotted at that point.